Product:
Starburst Galaxy
- Overview
- Query data
- Explore data
- Data products
- Share data
-
Manage catalogs
- Overview
- Manage catalogs
- Object storage
-
Non-object storage
- Overview
- Amazon DynamoDB
- Amazon Redshift
- Amazon S3 Tables
- Apache Cassandra
- Apache Druid
- Apache Pinot
- Apache Polaris
- Azure Synapse
- ClickHouse
- Elasticsearch
- Galaxy Telemetry
- Google BigQuery
- Google Sheets
- Lakekeeper
- MariaDB
- Microsoft SQL Server
- MongoDB
- MySQL
- OpenSearch
- Oracle
- PostgreSQL
- Salesforce
- Salesforce Data Cloud
- SAP HANA
- Snowflake
- Unity
- Sample data sets
- Query performance
- Query routing
- Data ingest
- Migrating queries
- Overview
- Manage Galaxy access
- Manage data access
-
Manage cluster connectivity
- Overview
- SSH tunnels
- Galaxy IP allow list
- Amazon AWS
- Microsoft Azure
- Google Cloud
-
Private connections
- Overview
- AWS PrivateLink
- AWS PrivateLink for RDS (preferred)
- AWS PrivateLink for RDS (legacy)
- AWS PrivateLink for Snowflake
- AWS PrivateLink for MongoDB Atlas
- AWS PrivateLink for on-prem data source
- Connect clients to AWS PrivateLink
- Azure Private Link
- Azure Private Link for ADLS
- Azure Private Link for Azure database PaaS
- Azure Private Link for a database running a VM
starburst galaxy > working with data > query data > Use query results
Use query results #
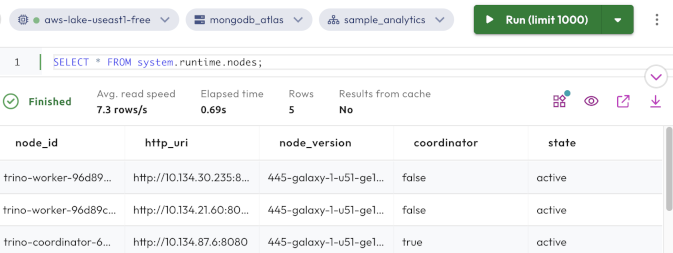
The results returned from a query are shown in the results pane in the bottom part of the query editor.
Results pane #
The results pane shows the progress of the query processing and the results. Typically, one or more rows and columns are returned by a query.

-
Adjust your view of the results pane:
- Click the expand_circle_down down arrow to close the results pane or the expand_circle_up up arrow to open it.
- Click and drag the border between the editor and results panes to resize the
results pane.
-
Monitor the query process from the status bar, which displays current query processing statistics:
- Status: Displays the progress of the querying process, and then the final status when complete, whether it is finished, cancelled, or failed.
- Avg. read speed: Calculates from all sources, in rows per second.
- Elapsed time: Calculates, in seconds, from when the query process started.
- Rows: The number of rows returned.
- Results from cache: Indicates whether results were read from cached results instead of the data source.
- Cached at: Displays the point in time when results were cached. This
statistic is only visible in the status bar if results were read from the
cache.
While a query is running, a progress estimate for that query is shown. If your result set is very wide or is greater than 1000 rows, it is truncated.
-
Utilize the active links:
- widgets Opens a dialog to create a data product from a query. See Create a data product for more details.
- visibility Opens the details page for the most recently run query.
- open_in_new Opens the Trino web UI. To see details, the cluster must be running.
- vertical_align_bottom Downloads results as a CSV file, if results are shown from the last query. Results are not stored, and are only available until a new query is run or your page is closed or refreshed, whichever comes first.
Learn more #
- Review query history
- Save and reuse queries
- Schedule jobs
- Federate queries from different sources
- Use session properties
Is the information on this page helpful?
Yes
No