Table and view level #
The third level of the catalog explorer is the table or view level, which contains a number of panes of information about the currently selected table or view.
Header section #
The header for table level panes shows the name of the currently selected table or view. Use the youtube_searched_for reindex icon as described in Catalog indexing.
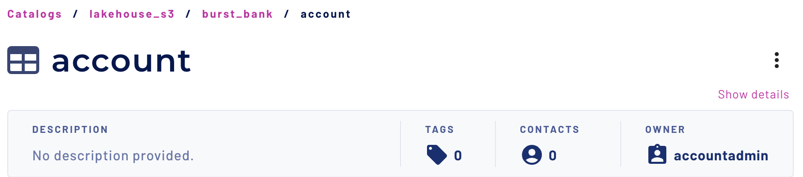
Table or view metadata #
View and edit metadata associated with your table or view such as a description, the source comment, associated tags, a list of user contacts, and the table or view’s owning role.
Click the edit pencil icon to edit table or view metadata. Table and view metadata can only be edited by the table or view’s owner. Metadata is otherwise read-only. If the table or view does not have an assigned owner and the parent schema does, then the table or view inherits the schema’s owner. If the parent schema does not have an assigned owner, table and view ownership is inherited from the catalog. Tags inherited from the parent catalog or schema are denoted by a subdirectory_arrow_right downward, right-pointing arrow preceding the tag name.
Click Show details to see an expanded view of the table or view’s metadata:
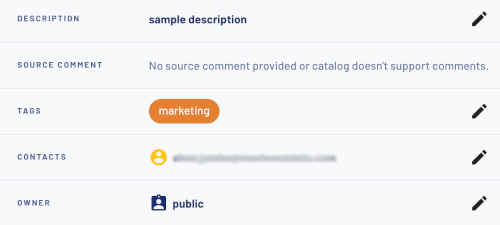
- Description displays the description of the table or view, if any.
- Source comment displays a SQL comment, if one is embedded in the table or view. The source comment field is read-only.
- Tags lists the tags associated with the table or view. Apply tags to the table or view to enable attribute-based access control policies.
- Contacts displays users who can provide information and support for the table or view. You can add any user with a role that owns the table or view directly, or indirectly.
- Owner displays the owner of the table or view.
Options menu #
Click the more_vert options menu to show the following options for table level panes:
- Query data opens a new query editor tab with the current catalog and schema pre-selected in the location drop-down menus.
- Set/View notification (Preview). Opens a dialog from which you can configure to be notified if this table or view changes or if a quality check fails. See Table or view change notifications.
Columns #
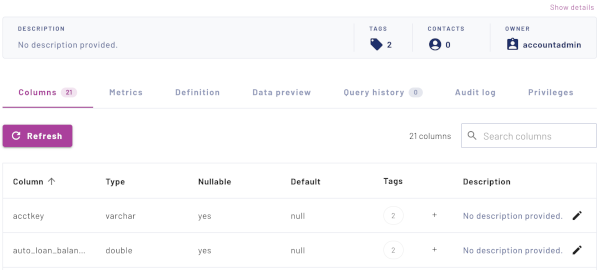
The Columns pane displays a list of columns found within the table or view, and relevant information for each of them.
Refresh the list of columns, or search through the list by using the Refresh button on the left, or the Search columns field on the right, respectively.
The following columns are shown:
- Column lists the name of each column.
- Status: This column shows the catalog indexing status for roles with the Manage account work privilege.
- Type lists the datatype of the column.
- Nullable lists if the column accepts
nullvalues. - Default lists the default value of the column.
- Tags lists the tags associated with the column. Apply tags to the column to enable attribute-based access control policies. Click + to add or remove tags.
-
Description displays the description of a column, if provided. Click the edit pencil icon to edit the description.
Cluster participation #
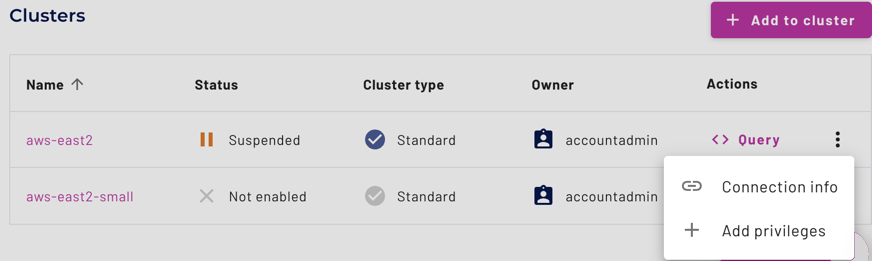
The list of Clusters at the bottom of the Columns list shows the clusters that contain the currently selected catalog. The list shows the following information about each cluster:
- Name: shows the name of the containing cluster.
- Status: displays the status.
- Cluster type: Standard, Fault Tolerant, or Accelerated.
- Owner: the role that owns the cluster.
- Actions: Clickable operations to run on this cluster, including:
- Query: Opens a new query editor tab with the current catalog and schema pre-selected in the location drop-down menus.
- more_vert
Options menu. Click to show:
- Partner connect: Directs you to partner connect where you can get the connection information required to connect to the cluster from various client tools.
- Add privileges: Opens an Add privileges dialog that allows you to add roles that have access to this cluster.
Metrics #
The Metrics pane displays a visual analysis of important metrics about the current catalog, schema, table, or view:
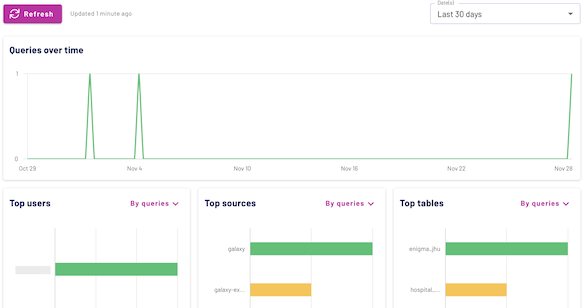
Use the Dates menu above the chart to view data for different time intervals.
Charts display the following metrics:
- The Queries over time chart shows the absolute number of run, queued, and failed queries.
- The Top users chart shows the most active users by processed queries, by used CPU time, by data read, or by data written.
- The Top sources chart shows the most active client applications, such as the query editor, the Trino CLI, and others by processed queries, by used CPU time, by data read, or by data written.
- The Top tables chart shows the most active tables and views by processed queries, by data read, or by data written.
Quality #
View the results of data quality checks or create new data quality checks in the Quality tab at the table, schema, or catalog levels of the catalog explorer. See Data quality for further information.
Lineage #
Data lineage lets you track the history of tables that were copied or updated from other tables to help you understand how your data has changed over time.
See Data lineage for further information.
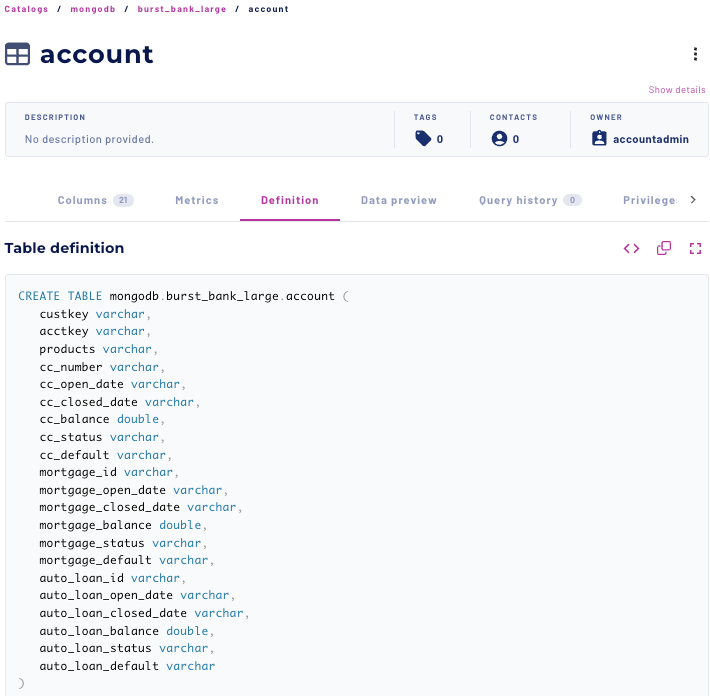
Definition #
The Definition pane displays the results of a SHOW CREATE TABLE or
SHOW CREATE VIEW statement.
- Click the code Edit icon to open the statement in the query editor.
- Click the content_copy Copy icon to copy the statement to the clipboard.
-
Click the fullscreen Expand icon to view the full query text.
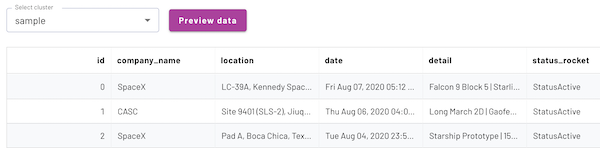
Data preview #
The Data preview pane allows you to view a preview of the data found in a table.
To preview the data of a table or view, select a cluster from the Select cluster menu and click on Preview data:
Query history #
The Query history pane shows a list of queries that accessed this table or view. Look for queries that occurred within a pre-defined date range using the Dates menu on the right.
Query history is limited to your role’s history unless your current role is
accountadmin or your role has the View all query
history privilege.
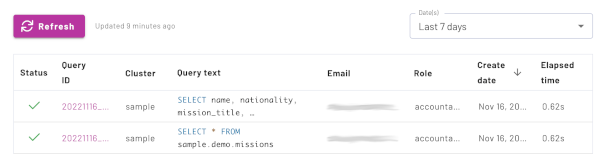
Click Refresh to reload queries in the list.
The following columns are displayed:
- Status uses check for successfully completed queries, and close for failed queries.
- Query ID shows the unique identifier for each query; click the ID to open the Query details pane for the query.
- Cluster is the name of the cluster used to process the query.
- Query text displays the full or partial SQL text of the query.
- Email identifies the user who submitted the query.
- Role specifies the name of the role used by the user when submitting the query.
- Submitted date uses the browser timezone and shows the start date and time of the query processing.
- Elapsed time is the total duration for processing the query.
Audit log #
The Audit log pane displays an audit trail of administrative actions related to this catalog and its schemas, tables, views, materialized views, and columns. Your current role must have the View audit log privilege in order to see audit log entries from all users.
The following columns are shown:
- Operation: The configuration change that was performed. Possible values include update, delete, suspend, and others depending on the object.
- Object: The type of object, such as catalog or schema, for which the configuration was changed.
- Object name: The name of the specific object.
- What changed: A description of the changed attributes including values.
- User: The user who performed the change.
- Time of change: The date and time the change was performed.
Privileges #
User accounts with permission to view privileges have access to the Access control pane. The Access control pane allows you to view privileges based on the currently active role.
The following columns are displayed:
- Role specifies the name of the role.
- Privileges shows the privileges for the role and ownership rights.
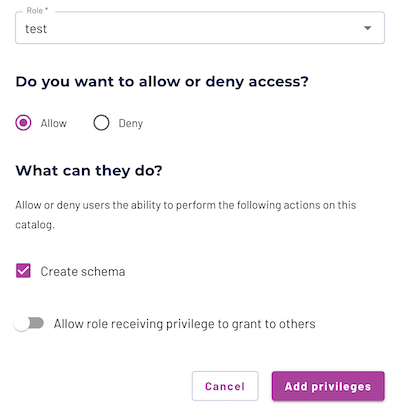
Use the Add privileges button to add or remove access to a privilege:
-
Select a role from the menu.
-
By default, new privileges allow access rights, but you can click the deny switch to create a deny privilege.
-
Select the privileges to grant to the current role, and click the Add privileges button to save the privilege grants.
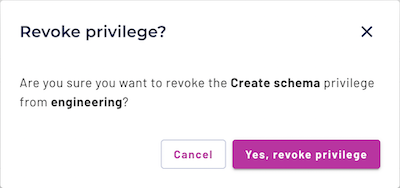
To revoke an existing privilege:
- Click the X on a privilege tag.
- In the resulting dialog, click Yes, revoke privilege.
Options menu details #
The options menu for table-level panes in the catalog explorer includes the following features.
Table or view change notifications #
Set or review in-app notifications about changes to your schemas, tables, or views.
CREATE statements. It only sends
notifications about changes made using ALTER and DROP statements.Click the Set/View notification option in the more_vert options menu to open the Set in-app notification settings dialog.
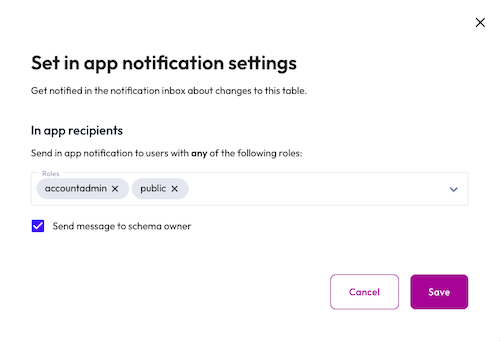
Use the Roles drop-down menu to choose one or more roles to receive notifications.
Select the Send message to schema owner checkbox to send notifications to the asset owner in addition to the specified roles.
Is the information on this page helpful?
Yes
No