Product:
Starburst Galaxy
- Overview
- Query data
- Explore data
- Data products
- Share data
-
Manage catalogs
- Overview
- Manage catalogs
- Object storage
-
Non-object storage
- Overview
- Amazon DynamoDB
- Amazon Redshift
- Amazon S3 Tables
- Apache Cassandra
- Apache Druid
- Apache Pinot
- Apache Polaris
- Azure Synapse
- ClickHouse
- Elasticsearch
- Galaxy Telemetry
- Google BigQuery
- Google Sheets
- Lakekeeper
- MariaDB
- Microsoft SQL Server
- MongoDB
- MySQL
- OpenSearch
- Oracle
- PostgreSQL
- Salesforce
- Salesforce Data Cloud
- SAP HANA
- Snowflake
- Unity
- Sample data sets
- Query performance
- Query routing
- Data ingest
- Migrating queries
- Overview
- Manage Galaxy access
- Manage data access
-
Manage cluster connectivity
- Overview
- SSH tunnels
- Galaxy IP allow list
- Amazon AWS
- Microsoft Azure
- Google Cloud
-
Private connections
- Overview
- AWS PrivateLink
- AWS PrivateLink for RDS (preferred)
- AWS PrivateLink for RDS (legacy)
- AWS PrivateLink for Snowflake
- AWS PrivateLink for MongoDB Atlas
- AWS PrivateLink for on-prem data source
- Connect clients to AWS PrivateLink
- Azure Private Link
- Azure Private Link for ADLS
- Azure Private Link for Azure database PaaS
- Azure Private Link for a database running a VM
starburst galaxy > working with data > query performance and monitoring > Query reports
Query reports #
The Query > Query history pane shows a list of all queries processed on all clusters.
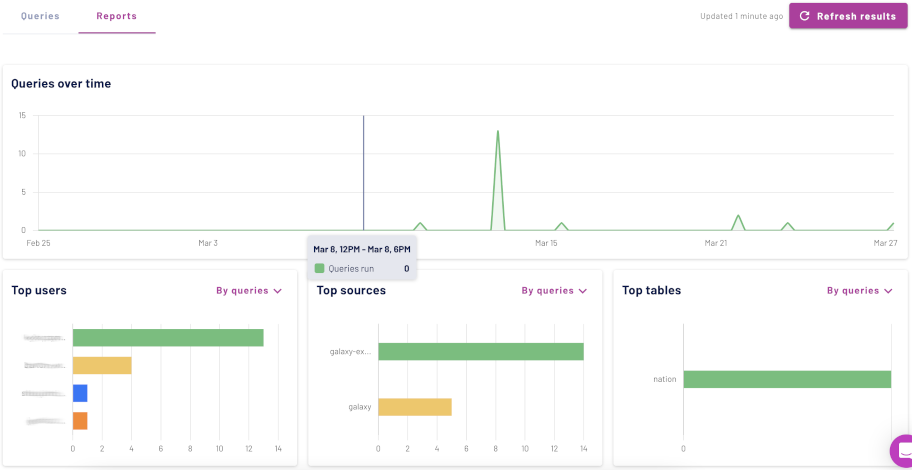
Reports pane #
Click the Reports tab on the Query history pane to view information about all completed queries. This shows the following metrics:
- The Queries over time chart shows the absolute number of run, queued, and failed queries.
- The Top users chart shows the most active users by processed queries, by used CPU time, by data read, or by data written.
- The Top sources chart shows the most active sources, so client applications like the query editor, the Trino CLI, and others by processed queries, by used CPU time, by data read, or by data written.
- The Top tables chart shows the most active tables and views by processed queries, by data read, or by data written.
Is the information on this page helpful?
Yes
No