Data quality #
This page describes how to assess the quality of data in tables and views. You can create quality tests to determine, for example, whether a column contains nulls, whether a column’s data matches its specified data type, or whether a column’s data is within its expected range.
Data quality dashboard #
View the results of data quality checks in the Quality tab at the table, schema, or catalog levels of the catalog explorer.
You can also view data quality test results for your Starburst Galaxy account as a whole in the data quality dashboard, which you invoke with Data > Data quality in the navigation menu.
Quality checks are run only for tables and views. The Quality tab at the schema and catalog levels gather into one place for quick reference of all the table-level quality checks set up under those schemas or catalogs. The account-level Data quality dashboard gathers into one place all the quality checks set up for the entire account.
Required privileges #
Dashboard visibility depends on the active role set’s table privileges. To see a dashboard created by others, the role must have, at minimum, the Select from table privilege on the table of interest. All of the table’s columns must be visible to the role, and must not have DENY granted for any column.
To create, edit, or delete a data quality check routine, the role must have ownership of the table or schema of interest or have the Manage table data observability privilege on the table of interest or its containing schema or catalog.
Create data quality check #
To create a data quality check, click Create quality check, which is available in the Quality tab at all levels of the catalog explorer, or in the account-level dashboard. At all levels, this button shows the same dialog, with extra features if invoked from the catalog explorer table level.
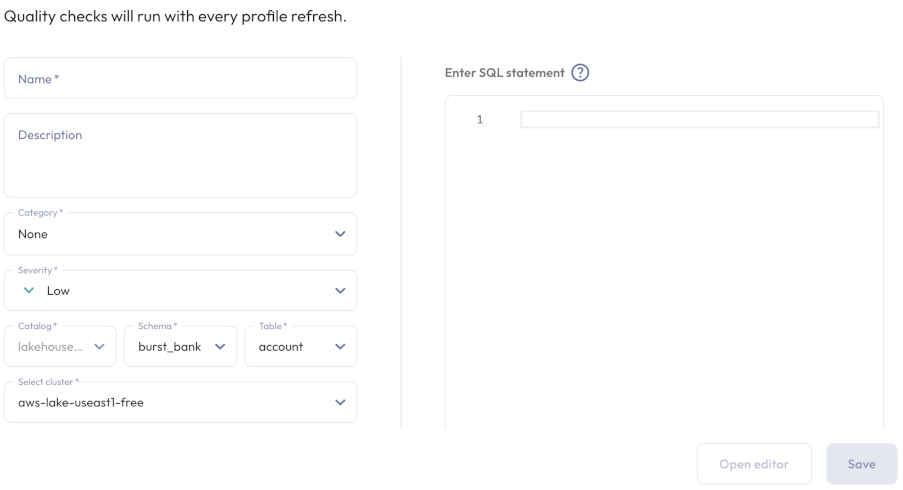
Perform the following steps:
-
Provide a Name and an optional Description for this quality check.
-
Expand the Category drop-down menu and select a data quality dimension to test: Validity, Completeness, Accuracy, Consistency, or None.
-
Expand the Severity drop-down menu, and select a severity level: Low, Medium, High or Critical.
-
If you clicked Create quality check from the table level, this check applies to the current table. At all other levels, specify the table of interest by selecting its Catalog, Schema, Table, and Cluster from the respective drop-down menus.
-
For quality checks on object store catalogs, this quality check can use either data quality expressions or a SQL statement. For non-object catalogs, specify a SQL statement. For all catalogs, the SQL statement must return a boolean result. For examples, see SQL-based quality check.
-
Click Open editor, enter the statement in the SQL statement field. If opened from the table level, you can fill the statement field with a template by clicking the Append SQL statement template button. Click Validate SQL to ensure the statement returns a boolean result.
-
When your SQL statement passes validation, click Save.
Data quality check results #
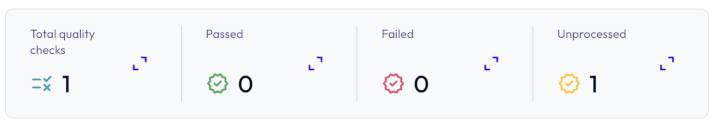
Data quality results are recorded and displayed on the catalog explorer’s Quality tabs and on the account-level Data quality dashboard. These dashboards list metrics including the total number of checks executed, the number of passed and failed quality checks, and the number of unprocessed quality checks. The unprocessed category includes quality checks that have not been scheduled or evaluated manually.
You can also view a graphical summary of pass and fail ratios grouped by status category and severity in the Category ratio and Severity ratio panes. A graph that displays Data trends over the previous 30 days is also available.
The Quality checks section lets you see all quality checks grouped by
passed, failed, or unprocessed status. Select a status category from the
drop-down menu to see the top four quality checks in the specified category. To
see more quality checks, click View more status checks.
For a more detailed view of quality checks that fall within a particular status category, click the expand_content icon beside the corresponding status category of interest.
This opens a dialog that organizes quality checks in the following tabs and columns:
- Total: The total number of quality checks executed for the selected category.
- Passed, failed, or unprocessed: Selects a category to organize the executed quality checks.
- Catalog, Schema, or Table: Lists the catalogs, schemas, or tables that have executed quality checks.
- Status: Shows the status of the quality check.
If needed, you can also export data quality check results to Amazon CloudWatch.
Quality tab at the table level #
The Quality tab at the table or view level of the catalog explorer provides more detail than the Quality tabs at other levels because it includes information specific to the currently selected table or view.
The Data quality section provides the following information:
- The total number of columns for the current table.
- The total row count for the current table.
- The Last updated heading displays the timestamp when the statistics data was last refreshed.
- The next optimization job, if one is scheduled to run.
- The total number of successful and failed quality checks are listed under Success and Failed headings respectively.
The Number of records chart plots the changes in the table’s total number of records over the last 30 days. Refreshing the statistics data creates a new data point.
For a table or view that has a quality check defined, the Quality tab includes a Column profile section, with two subsections, one also named Column profile and Applied rules.
Column profile pane #
Click the Column profile button to display the number of columns in the table and the following statistics:
- Column: The name of the column. Click the column heading to sort in ascending or descending alphabetical order.
- Data type: The data type for the column’s data, such as
varchar. - Not null vs null %: The percentage of column data that is not
null. - Distinct values: The total number of unique values in the column.
- Max value: The maximum value for columns with numerical data.
Non-applicable columns are labeled
null. -
Min value: The minimum value for columns with numerical data. Non-applicable columns are labeled
null.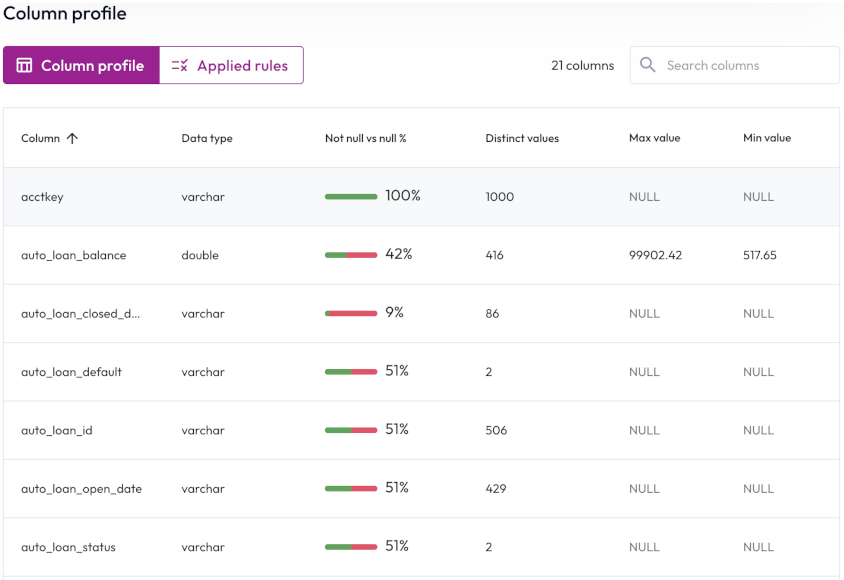
To reorder the statistics table, click a column name to sort by that column. Click the column name again to reverse the sort order.
Applied rules pane #
Click Applied rules to view your data quality monitoring rules, or to create a new rule. The Applied rules tab displays a list of information about each rule such as name, status, description, expression or SQL statement, and severity level.
Click themore_vertoptions menu at the end of a row to evaluate, edit, or delete the selected quality rule.
Expression-based quality checks #
You can write an expression to determine the scope of a data quality monitoring rule. For more details and examples of expression-based quality checks, see Data quality expressions in the Reference navigation menu.
SQL-based quality checks #
You can write SQL statements that return a boolean result to be run on a schedule to validate data. There are two methods for writing SQL-based data quality checks:
-
Select an aggregate function with a comparison operator. This returns the boolean result of the comparison. For example:
SELECT avg(totalprice) > 5000 FROM tpch.tiny.orders -
Use a Common Table Expression (CTE) to build a temporary result table, followed by an
EXISTSpredicate statement to test whether there are any values in the result table. This returns a boolean result.The following example generates a CTE that includes any row in the
lineitemtable whoseorderkeycolumn is NULL. The statement goes on to test whether there are any entries in the result table.The example shows two ways to minimize processing time for this SQL test:
- When building the CTE, select only the column of interest instead of a whole row.
- The EXISTS subquery stops when a single record is found instead of waiting to count them all.
WITH cte-result-table AS (

  SELECT orderkey from tpch.tiny.lineitem
    where orderkey = null
)
SELECT EXISTS (SELECT 1 FROM cte-result-table)
You can author checks for a single column attribute, multiple attribute checks across multiple columns, or attribute checks at the row level.
A quality check can be executed manually, or scheduled as a cron job. Checks run on a user’s own cluster and incur compute costs.
;.Is the information on this page helpful?
Yes
No