Monitor cluster utilization #
Cluster utilization lets you analyze CPU usage, memory, and size metrics of your cluster deployments.
To access the cluster utilization view, click the cluster name in the cluster list.
Top row #
The top row of the cluster utilization pane shows the name of the cluster, a partner connect button, and an more_vert options menu. For currently suspended clusters, there is also a Resume button.
If the cluster is currently running, the Resume button does not display.
Click partner connect to get the connection information required to connect to the cluster from various client tools.
The more_vert options menu provides the following actions:
- Query: Opens the query editor using the current cluster as context.
- Resume: For suspended clusters, lets you resume the cluster.
- Edit cluster: To edit the cluster.
- Change owner: To change the owner of the cluster to a different role.
- View cluster activity: To view the recent activity of a running cluster.
- Delete cluster: To delete the cluster.
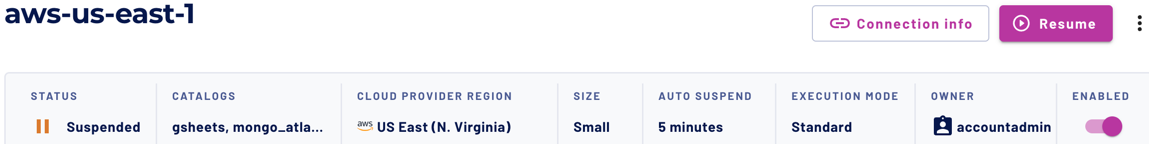
Cluster attribute row #
The shaded row of cluster attributes includes the following:
- Status: The cluster’s current status.
- Catalogs: Lists the configured catalogs used in the cluster.
- Cloud provider region: Shows the cloud provider and region.
- Cluster Size: The configured cluster size.
- Auto suspend: The configured time for an inactive cluster to automatically transition to suspended status.
- Execution mode: Standard, Fault-tolerant, or Accelerated.
- Owner: The role that owns the cluster.
- Enabled: The toggle switch to enable or disable the cluster.
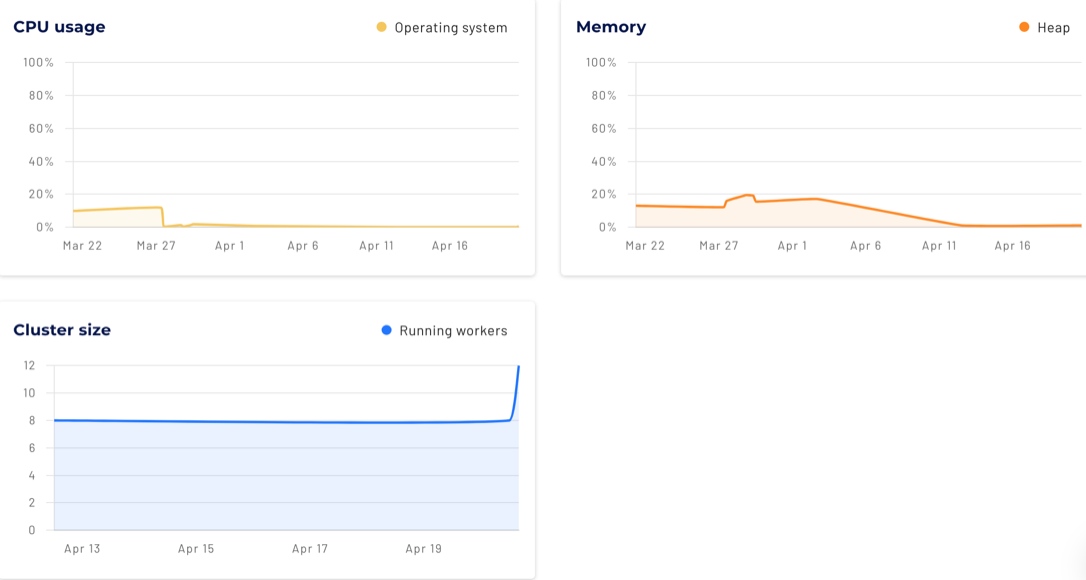
Cluster metrics #
-
Use the drop-down menu in the Dates field to filter cluster activity by date. If no graphs are drawn, select Last 30 days or longer.
-
When the End date is in the future, the cluster metrics automatically update every 15 seconds.
-
Analyze metrics with the following charts:
-
The CPU usage chart shows CPU usage of the cluster system.
-
The Memory chart shows the memory usage of the cluster.
-
The Cluster size chart shows the number of running workers.
-
The Queries chart shows the number of running and queued queries.
-
Is the information on this page helpful?
Yes
No