Query details #
You can view details of a query by navigating to the query details pane.
There are three ways to access the query details pane:
- From the query editor results pane: after a query finishes running, click See query details.
- From the Query insights pane, Queries tab: click the query ID for a specific query from the list.
- From Data maintenance tasks, which run as queries whose history you can see from the Table level details.
The Query details pane begins with a Query ID section that shows this query’s final status. You can explore additional information divided into two tabs, General and Advanced.
galaxy_telemetry
catalog. The generated query is pre-populated with the current query ID.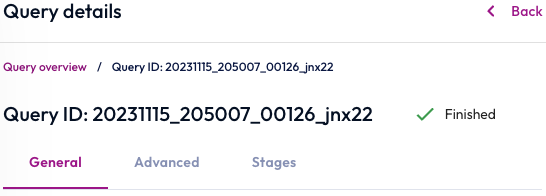
There are four tabs in the query details pane that give you detailed information about the processing and execution of a specific query.
General tab #
The General tab displays information for successful and failed queries.
A successful query shows the query text, basic information, and query execution details.
A failed query shows the query text and query execution details. It also shows additional details in basic information and a failure log sections.
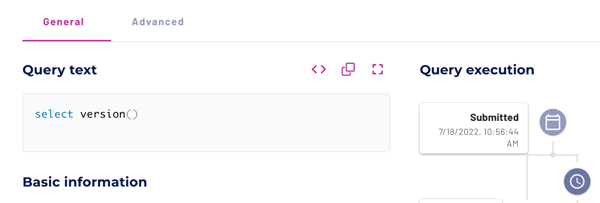
Query text #
The query text shows you the full SQL statement of the query. The query text pane has the following shortcuts:
- code: Edit in the query editor
- content_copy: Copy to clipboard for efficient transfer to other IDE or BI tools
-
fullscreen Opens a full screen to view the query text
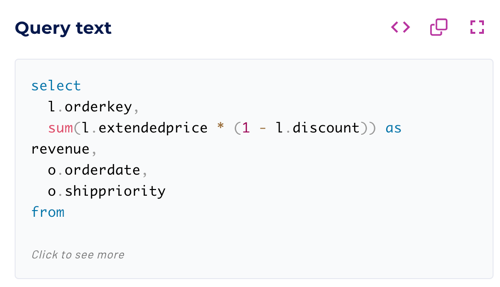
Alternatively, click anywhere in the text box to open a full screen view of the query text with Pretty print, Copy to clipboard, and Close buttons.
Basic information #
The detailed information for successful or canceled queries includes:
- Role: The role used by the user when submitting the query.
- Client: Information about the client application submitting the query.
- CPU time: Total CPU time across all workers and tasks in milliseconds used for query processing.
- Cluster: The cluster used to run the query.
- Client address: Address of the client that submitted the query.
- Elapsed time: The elapsed time for processing the query in milliseconds.
- Encoding: Type of encoding and compression formats used for spooled query results.
- Compression ratio: Original size of the query results compared to the spooled and compressed size.
- Inlined/spooled bytes: Total number of inlined and spooled bytes.
Canceled queries display the following status Failed - canceled by user.
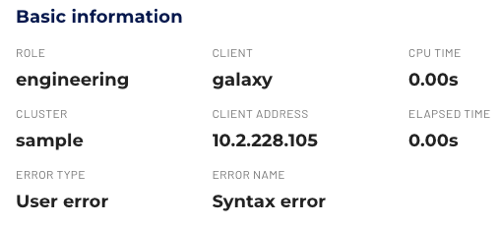
When queries fail for other reasons, the basic information expands to include the following details:
- Error type: The classification of an error. The most common error types
are
User CanceledandUser Error:User Canceled: The query was stopped by the user.User Error: The SQL query statement submitted by the user contained a syntactic or semantic error.
- Error name: The name of the error, such as
syntax error.Syntax error: A user error indicating that the query submitted by the user contains a syntactic or semantic error.
Query details for a failed query:
Index and cache usage #
If this details page is for a query on an object storage data source in an accelerated cluster, the General tab displays index and cache usage metrics about query performance and resource utilization.
Index and cache usage includes the following metrics:
- Overall: Combined score for performance gains from filtering and projection.
- Filtering: Indicates acceleration based on
indexing. Percentage score
for independent predicates in the
WHEREclause. -
Projection: Indicates acceleration based on the data cache. Percentage score for items in
SELECTclauses.
These metrics show the percentage of query splits that are handled by Starburst Warp Speed of the total number of query splits.
Query execution #
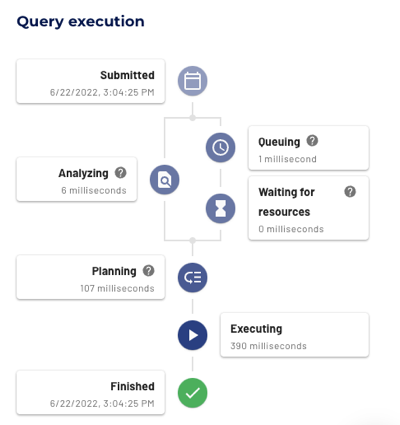
The Query execution diagram displays performance and timing data about the different stages during query processing.
Query status #
The query execution diagram includes the following statuses:
- Analyzing: The SQL query text is verified and analyzed against metadata from the data sources and SQL semantics. Displays the time spent in milliseconds.
- Cancelled: The query was successfully cancelled.
- Executing: The query is executing and has at least one running task.
- Failed: Query execution has failed.
- Finishing: The query is finishing, for example when performing the final commit for auto-commit queries.
- Finished: The query processing has completed and all output was consumed.
- Planning: The query execution plan is created and optimized with the help of metadata, including table statistics. Displays the time spent in milliseconds.
- Queuing: Query processing is on hold, waiting for the other queries to be processed. Displays the time spent in milliseconds.
- Starting: The query execution is starting.
- Waiting for resources: Query processing is on hold, waiting for resources to process the query. The value can include analysis time. Displays the time spent in milliseconds.
The Query execution diagram shows the query plan steps:
Stages tab #
The Stages tab shows details about query processing stages. A stage is the runtime embodiment of a plan fragment in a distributed query plan, and is identified by a stage number.
The following information is included on this tab:
- User: The user who submitted the query.
- Query state: The current status of the query in the processing flow. Possible values include queued, waiting for resources, planning, starting, running, finishing, finished, and failed.
- CPU time: Total cumulative CPU time used by this query.
- Elapsed time: The elapsed time for the query.
- Active: The percentage ratio of processing time compared to wait times.
Query stage information is rendered in two different views, List and Graph. Use the toggle in the upper right corner to switch between the two visualizations.
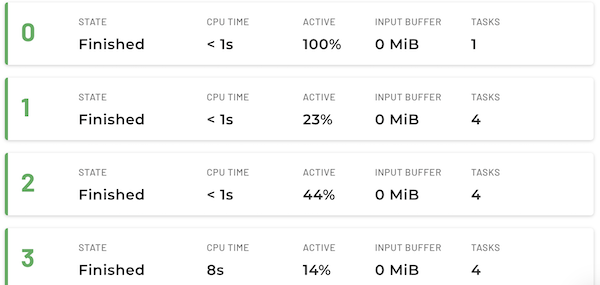
List view #
The List view focuses on statistics about stages and their tasks. This view is useful for examining stage performance, and understanding whether all nodes in the cluster perform well.
Several stage level statistics are shown:
- State: State of the task.
- CPU time: Total cumulative CPU time used by this query.
- Active percentage: The percentage of CPU time out of the total scheduled time, which includes both CPU time and waiting times. This metric estimates the query’s processing efficiency. Ideally, the value should be a high percentage. A low percentage indicates the query is spending a long time reading from storage.
- Input buffer: Data received during the exchange that is kept in buffers on the target and source sides of the exchange. The buffer sizes for each side can be adjusted independently.
-
Tasks: The total number of tasks.
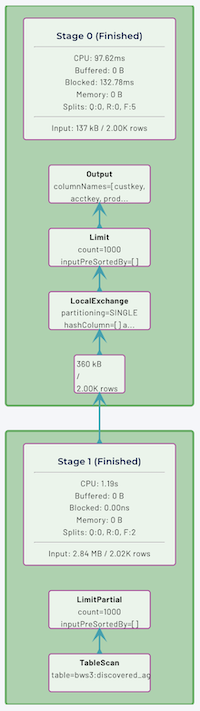
Graph view #
The Graph view provides a visualization of the distributed query plan and shows how plan fragments are mapped to stages. The visual representation is a tree, in which nodes represent stages and edges indicate how data is transferred between stages. A stage processes data produced by its children.
Each of the nodes shows stage level statistics, as well as a graphical representation of the corresponding plan fragment. A plan fragment is rendered as a tree of operators. Finally, statistics about the number of rows and total size of the data read from each child stage are also shown.
Advanced tab #
The Advanced tab shows information about the accessed tables, query plan, and execution details.
Note: If your query was cancelled or failed, the advanced tab generally has nothing to display and is empty. Some cancelled queries may show the information that was in progress before the cancellation.
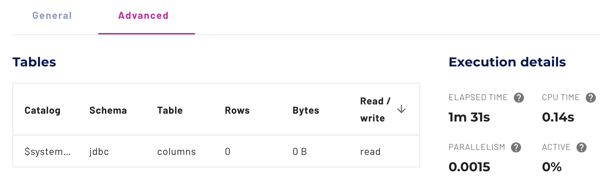
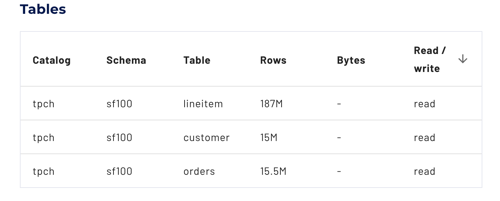
Tables #
The tables pane displays statistics about the tables accessed by the SQL query.
- Catalog: Name of the catalog that contains the table in this row.
- Schema: Name of the schema that contains the table in this row.
- Table: Name of the table accessed by the SQL query.
- Rows: The number of rows processed from the table.
- Bytes: The number of bytes processed from the table.
- Read/Write: The operation type for the data.
Click one of the header options to arrow_upward arrow_downward sort the table.
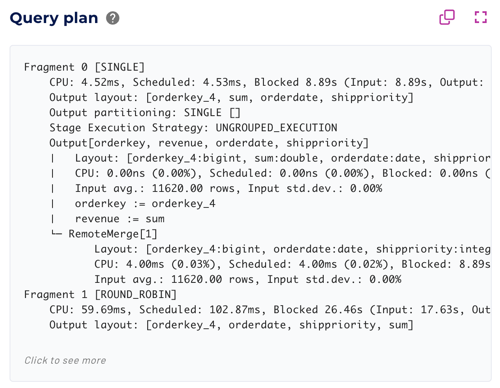
Query plan #
The distributed execution plan includes a full EXPLAIN
plan of the submitted query,
including costs for each stage. It is identical to the output from EXPLAIN
ANALYZE <query>.
Click the Query plan field to see more information, or use the following shortcuts:
- content_copy: Copy to clipboard for efficient transfer to other IDE or BI tools.
- fullscreen: Opens a full screen to view the explain plan.
Alternatively, click the text box to open a full screen view of the explain plan.
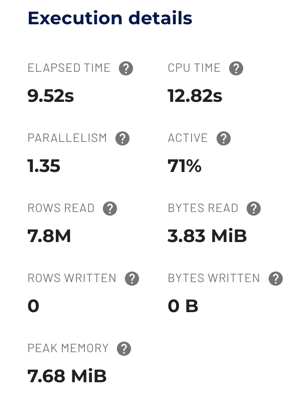
Execution details #
Execution details provide statistical data about the query processing.
The execution details include the following metrics:
- Elapsed time: The amount of time in milliseconds it took the query to execute.
- CPU time: Total accumulated CPU time in milliseconds across workers and threads.
- Parallelism: Estimated value of how much the workload was processed in
parallel, calculated from
CPU timedivided by theElapsed time. - Active: Estimated value of how efficient processing was performed,
calculated from
CPU timedivided by thetime spent waiting as scheduled. - Rows read: Total number of rows read from the data sources.
- Bytes read: Total number of bytes read from the data sources.
- Rows written: Total number of written rows.
- Bytes written: Total Number of written bytes.
- Peak memory: Maximum amount of memory directly tied to query resources used by a query at one time.
Hold the pointer over the help help icon for a definition of each detail field.
Cluster resources tab #
The Cluster resources tab shows the current query’s cluster usage statistics. These are represented in the following charts:
- CPU usage: Total CPU usage across workers and threads.
- Memory: Total memory used by a query.
- Cluster size: Number of running workers.
- Queries: Number of queries running and queued queries at a given time.
Charts highlight each stage of the query during the execution process:
- Waiting for resources
- The query is being dispatched to a coordinator.
- Planning
- Query execution is being started.
- Executing
- The query has at least one running task.
- All execution stages
- A cumulative view of query execution stages
Is the information on this page helpful?
Yes
No