Query the COVID-19 data lake #
One of Starburst Galaxy’s many uses is as an analytics engine on your data lakehouse or data lake. Once data is landed in S3, Azure, or Google Cloud, you can easily capitalize on the separation of storage and compute principle and use Starburst Galaxy as the engine behind your data lake analytics.
Tutorial architecture #
For this tutorial, analyze two different datasets from the public COVID-19 data lake on AWS.
- The first dataset is the Global Coronavirus (COVID-19) Data provided by Enigma. This dataset tracks COVID case counts.
- The second dataset shares information on US Hospital Beds, provided by Rearc. With this hospital information, you are able to see the capacity and occupancy of hospital beds for each state.
This guide walks through:
- Connecting Starburst Galaxy to AWS
- Querying the COVID-19 data lake
Login to Starburst Galaxy #
- Navigate to the Starburst Galaxy login page.
- If you don’t have an account, create a new one and verify the account with your email.
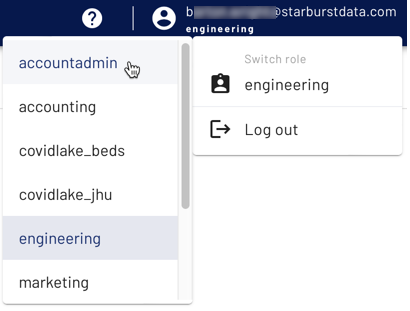
- Switch to a role with administrative privileges. If this is the first time
you’ve logged in, or you have never made any additional roles, you are
automatically assigned to the
accountadminrole.

Connect Starburst Galaxy to AWS #
Create a catalog in Starburst Galaxy #
Catalogs contain the configuration and connection information needed to access a data source. To gain this access, configure a catalog and use it in a cluster.
This tutorial uses the public COVID-19 data lake that lives on AWS, which simplifies the setup process. Instead of creating an S3 catalog, where you are required to have access to an AWS account, the data for this tutorial is accessible without charge and without AWS credentials. You connect to the AWS COVID-19 data lake dataset catalog.
- In the navigation menu, click Catalogs, then Create Catalog.
- Scroll down to Select a dataset.
- Select AWS COVID-19 data lake.
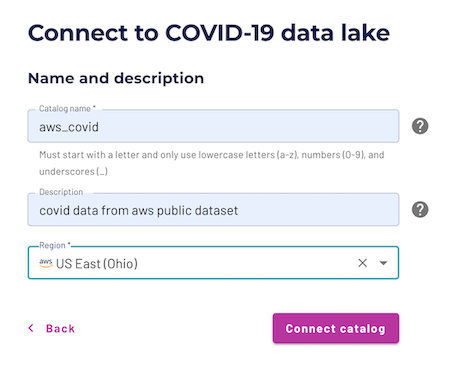
- Enter a relevant catalog name such as
aws_covid. - Add a relevant description such as
COVID data from AWS public
dataset
. - Add the
US East (Ohio) regionto the catalog as this is the only region where the dataset lives. - Select Connect catalog.

Select Save access controls on the Set permissions page to add the default access controls.
Create a cluster in Starburst Galaxy #
A Starburst Galaxy cluster provides the resources necessary to run queries against your catalogs. Use the Starburst Galaxy Cluster explorer to access the catalog data exposed by running clusters.
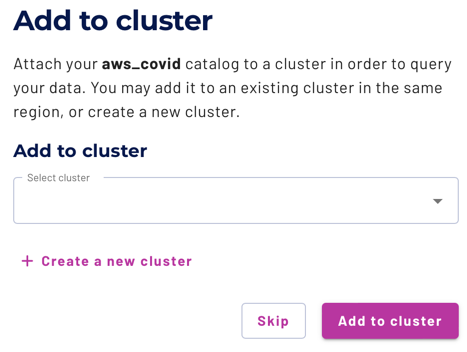
- On the Add to cluster page, select + Create cluster.

- Enter cluster name:
aws-covid-cluster. - Cluster size: Free.
- Cluster type: Standard.
- Catalogs:
aws_covid. - Cloud provider region: US East (Ohio) also known as us-east-2.
- Select Create cluster.
- Select Add to cluster.
- Select Query my data.
After configuring the catalog and cluster, you are directed to the query editor to continue the tutorial. Notice that the location drop-down menus in the top left corner have already selected the proper cluster and catalog for querying.

Configure role-based access control #
The Starburst Galaxy access control system uses roles to provide users with privileges for clusters, catalogs, schemas, tables and other types of entities, such as object storage locations.
Configure the accountadmin role to access the COVID-19 data lake location.
(But if you have already gone through these steps at the direction of a
different Starburst Galaxy tutorial, there is no need to repeat them.)
- In the navigation menu, select Roles and privileges.
- Click on the
accountadminrole name. - Select the Privileges tab.
- Select Add privilege.
- Add privilege to the
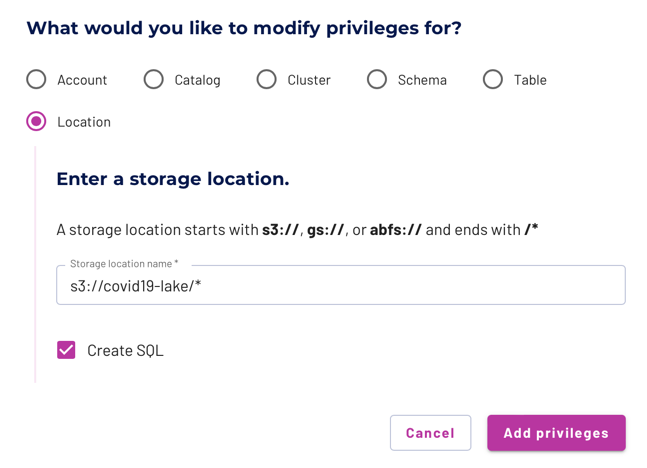
accountadminrole.- Choose location as the modify privileges destination.
- Add the storage location:
s3://covid19-lake/*. - Select Create SQL.
- Select Add privilege.

You now have access to all the data sources available in the COVID-19 data lake.
Create each table #
Navigate to the Query editor. Validate the location drop-down menus in the top right hand corner match the cluster and catalog previously created.

Create a schema to contain your tables.
CREATE SCHEMA covid_tutorial;
Now, in the location drop-down menus, select the covid_tutorial schema so that
you can easily run the tutorial queries.
Create the enigma_jhu table #
The enigma_jhu dataset provides the Global Coronavirus Data and is sourced from John Hopkins and provided by Enigma. This data tracks confirmed COVID-19 cases in provinces, states, and countries across the world, while also providing a county level breakdown in the United States.
Edit your saved query to match the following SQL command to create the table.
CREATE TABLE enigma_jhu (
   fips VARCHAR,
   admin2 VARCHAR,
   province_state VARCHAR,
   country_region VARCHAR,
   last_update VARCHAR,
   latitude DOUBLE,
   longitude DOUBLE,
   confirmed INTEGER,
   deaths INTEGER,
   recovered INTEGER,
   active INTEGER,
   combined_key VARCHAR
)
WITH (
   format = 'json',
   EXTERNAL_LOCATION = 's3://covid19-lake/enigma-jhu/json/')
;
Run a select all command to view your results. You can also use the table’s options menu to generate the command for you in the query editor.
SELECT * FROM enigma_jhu LIMIT 10;
Take notice that the admin2 column is actually the county, but was improperly
named. You can also see that the case information is aggregated for each
previously updated timestamp. We account for this as you query.
Create the hospital_beds table #
The second dataset is the USA Hospital Beds data sourced by Definitive Healthcare and provided by Rearc. This data provides intelligence on the number of licensed beds, staffed beds, and ICU beds for the hospitals in the United States.
Run the following SQL command to create the table.
CREATE TABLE hospital_beds (
   objectid INTEGER,
   hospital_name VARCHAR,
   hospital_type VARCHAR,
   hq_address VARCHAR,
   hq_address1 VARCHAR,
   hq_city VARCHAR,
   hq_state VARCHAR,
   hq_zip_code VARCHAR,
   county_name VARCHAR,
   state_name VARCHAR,
   state_fips VARCHAR,
   cnty_fips VARCHAR,
   fips VARCHAR,
   num_licensed_beds INTEGER,
   num_staffed_beds INTEGER,
   num_icu_beds INTEGER,
   adult_icu_beds INTEGER,
   pedi_icu_beds INTEGER,
   bed_utilization DOUBLE,
   avg_ventilator_usage VARCHAR,
   potential_increase_in_bed_capac INTEGER,
   latitude DOUBLE,
   longtitude DOUBLE
)
WITH (
   format = 'json',
   EXTERNAL_LOCATION = 's3://covid19-lake/rearc-usa-hospital-beds/json/')
;
Run a select all command to view your results. You can also use the table’s options menu to generate the command for you in the query editor.
SELECT * FROM hospital_beds LIMIT 10;
Query each table #
Now that the each table has been validated, query those tables for analytical insights.
Query the enigma_jhu table #
Now that the table is created, run the query that will filter out rows that are not within the US and do not have a value for any province or state. Since the case information is aggregated for each previously updated timestamp, only select the most recent timestamp on May 30, 2020.
SELECT
    fips,
    admin2,
    province_state,
    country_region,
    confirmed
FROM
    enigma_jhu
WHERE
    country_region = 'US'
    AND province_state not like ''
    AND last_update = '2020-05-30T02:32:48';
Run a query to aggregate the total confirmed cases for each state. Keep in mind that this dataset includes US territories as well as states.
SELECT
    province_state,
    country_region,
    SUM(confirmed) AS total_confirmed
FROM
    enigma_jhu
WHERE
    country_region = 'US'
    AND province_state not like ''
    AND last_update = '2020-05-30T02:32:48'
GROUP BY
    province_state,
    country_region;
Query the hospital_beds table #
In the original table, there are additional columns that you do not need for your analysis. Therefore, remove them from your query.
SELECT
   hospital_name,
   county_name,
   state_name,
   fips,
   num_licensed_beds,
   num_staffed_beds,
   num_icu_beds,
   potential_increase_in_bed_capac
FROM
    hospital_beds;
Run a query to aggregate the total hospital capacity for each state. Keep in mind that this dataset includes Puerto Rico and the District of Columbia.
SELECT
   state_name,
   SUM(num_licensed_beds) AS total_licensed_beds,
   SUM(num_staffed_beds) AS total_staffed_beds,
   SUM(num_icu_beds) AS total_icu_beds
FROM
    hospital_beds
WHERE
    state_name != ''
GROUP BY
    state_name;
Query the tables together #
Evaluate each state’s case count versus the number of licensed beds during May 30, 2020. You can see for each state if the state is running close to hospital capacity, or if they are managing with the current number of infections.
SELECT
 cases.fips,
 admin2 AS county,
 province_state,
 confirmed,
 growth_count,
 SUM(num_licensed_beds) AS num_licensed_beds,
 SUM(num_staffed_beds) AS num_staffed_beds,
 SUM(num_icu_beds) AS num_icu_beds
FROM
 hospital_beds beds,
 ( SELECT
     fips,
     admin2,
     province_state,
     confirmed,
     last_value(confirmed) OVER (PARTITION BY fips ORDER BY last_update) - first_value(confirmed) OVER (PARTITION BY fips ORDER BY last_update) AS growth_count,
     first_value(last_update) OVER (PARTITION BY fips ORDER BY last_update DESC) AS most_recent,
     last_update
   FROM
     enigma_jhu cases
   WHERE
     from_iso8601_timestamp(last_update) > TIMESTAMP '2020-05-01 01:00' AND country_region = 'US') cases
WHERE
 beds.fips = cases.fips AND last_update = most_recent
GROUP BY cases.fips, confirmed, growth_count, admin2, province_state
ORDER BY growth_count DESC;
Next Steps #
Now that you have explored the data lake analytics capabilities of Starburst Galaxy, continue exploring with our Query multiple data sources tutorial or connect your own data.
Is the information on this page helpful?
Yes
No