Data lineage #
Data lineage provides the ability to visualize data flow between tables, views, materialized views, and columns for workloads carried out in Starburst Galaxy.
Data lineage lets data engineers see the full in-Galaxy end-to-end lineage for any table-level entity or column, allowing you to more effectively plan changes or troubleshoot data issues by being able to evaluate how the data is transformed and moved both upstream and downstream of the source.
Data lineage also lets data consumers view the provenance of data for their data sets of interest, allowing them to verify that their data comes from valid and accepted upstream sources.
Automated lineage creation #
Data lineage is automatically created when transformation workloads that result in actual or logical data flow are executed by Galaxy. Events that establish lineage include, but are not limited to:
CREATE TABLE ASfrom one or more tablesUPDATEINSERT
Lineage view #
To access lineage, navigate to a table, view, or materialized view level entity of the catalog explorer and click the Lineage tab.
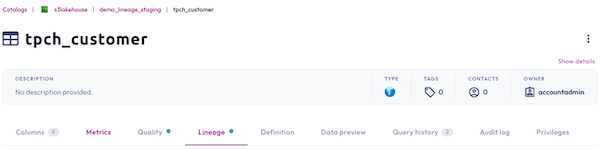
The Lineage tab is only available to roles with the View all data
lineage
privilege. The
privilege is granted to the accountadmin role by default, and must be granted
to other roles.
Lineage graph #
View and interact with the lineage graph to navigate how data flows to-and-from the table-level entity you have selected. The lineage graph automatically displays upstream and downstream lineage one hop in both directions. If you have selected a table-level entity that does not have any data flow to or from it, only a single node appears.
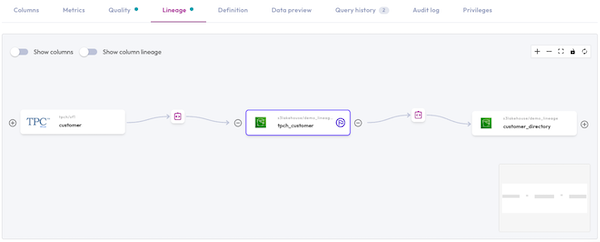
The lineage graph contains two toggle switches:
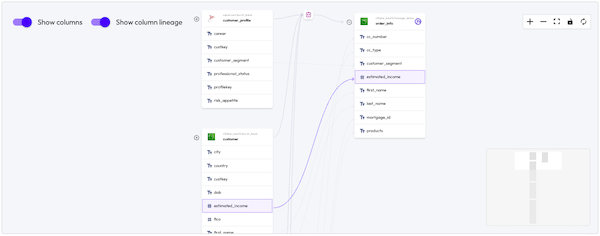
- Show columns: Displays the columns of each table in the graph.
- Show column lineage: Displays the edges between the columns of each table in the graph.
Enabling the Show column lineage toggle switch displays direct lineage between columns, including concatenations and calculations derived from multiple columns and tables. It does not display indirect lineage, such as columns derived from filtering.
The lineage graph has three components that can be interacted with:
- Entity node: A table-level entity that can be clicked to open a dialog with table-level metadata.
- Transformation node: A process node that sits on edges between entity nodes that resulted in movements of data. Click the transformation node to display current and historical transformation metadata from the last 30 days, including the SQL statement. Only workloads that have been processed by Galaxy are captured.
- Column node: A column that can be clicked to highlight its upstream and downstream lineage. Hovering over a column node displays the column’s full name and data type.
- Expander: The controls that lets you traverse up and down the lineage.
Lineage side pane #
View table-level entity and transformation metadata in their respective side panels to understand how your entity’s data has changed over time.
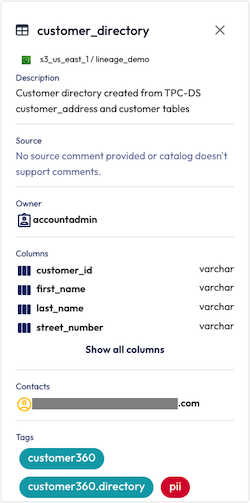
Entity side pane #
The entity side pane displays the Galaxy and source descriptions, owner, contact, column, and tag metadata of the entity.
On upstream or downstream nodes, click View this table to set that node as the currently selected node.
JOIN between multiple entities are
displayed. However, downstream entities only display data flowing into the table
of interest. To see downstream JOIN, set the downstream node as the currently
selected node.Transformation side pane #
The transformation side pane displays transformation metadata of current and historical events from the last 30 days. The pane includes the SQL statement that caused the transformation.
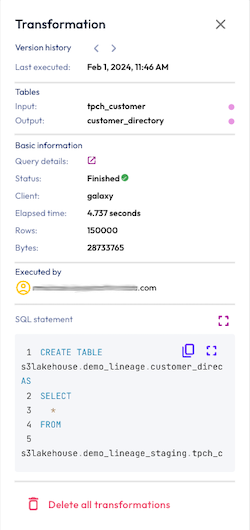
To delete the selected transformation, click Delete all transformations.
Is the information on this page helpful?
Yes
No