Insights usage metrics#
The usage metrics tab is accessed in Insights by clicking on Admin -> Usage metrics in the left-hand navigation.
It provides an overview of the cluster usage over a period of time and a cost estimation tool. You can also download the usage data or send it to Starburst from this tab.
Setup#
To access usage metrics through this tab, you must have Insights enabled to use persistent data by setting:
insights.persistence-enabled=true
You must also grant users and/or groups the right to access the Usage metrics feature, as described in Insights configuration. See examples in Authorization examples.
Date filter#
The time range for which the usage metrics are shown can be selected using a filter that provides the following options:
Today
Current month
Last month
Current year
Last year
All available dates
Custom range
Selecting the custom range option allows specifying a start and end date:

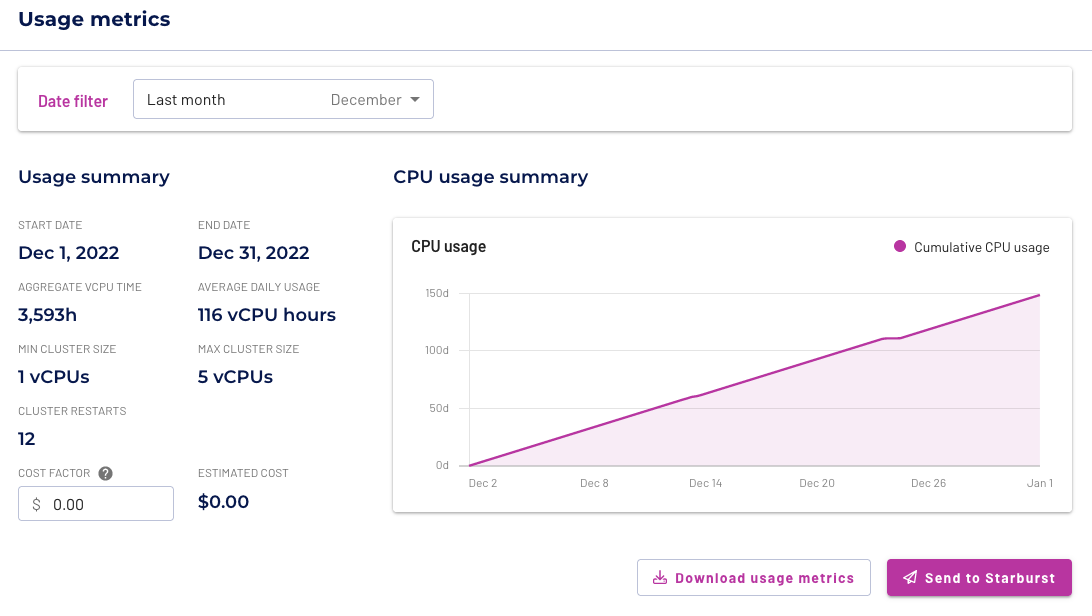
A summary of the usage for the selected time range is shown in the pane along with a chart depicting cumulative usage over time. The data for the selected time interval can be downloaded or sent to Starburst.
Cost estimation tool#
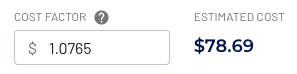
The cost estimation tool allows you to optionally input the cost factor (price per vCPU per hour) for the instance type used in your SEP cluster. The estimated cost of usage per filtered period of time is displayed.
Automatic usage metrics upload#
Usage metrics are automatically uploaded to Starburst every hour. This upload
consists of usage metrics collected since the previous upload. Note that if
insights-persistence-enabled is set to false, usage metrics are still
collected and stored in memory for up to 24 hours to support this upload.
You can configure this automatic metric upload in config.properties,
but the default values should suffice for most deployments. The following
snippet shows these configuration properties and their default values:
insights.data-upload-automatic.enabled=true
insights.data-upload-automatic.memory-store-interval=24h
insights.data-upload-automatic.interval=1h
insights.data-upload.protocol=https
insights.data-upload.endpoint=https://telemetry.eng.starburstdata.net/usage-metrics
JSON-formatted records are created for the entire cluster, for each collection interval. They include the following information:
Key |
Description |
|---|---|
|
The total number of registered nodes in the coordinator. |
|
The total number of CPU cores within the cluster, as the sum of all cores in the coordinator and in all registered workers. |
|
The total available CPU time available since the last cluster restart. |
|
The total cumulative CPU time used since the last cluster restart. |
|
A unique, random instance identifier for the cluster. |
|
The hash of the license file. The value is not encrypted, but is obtained using a cryptographic hash function. |
|
The value of the owner field from the license file. |
|
The license type. |
|
The value of the |
|
The SEP version used for the cluster. |
|
The signature for the data record. The value is not encrypted, but is obtained using a cryptographic hash function. |
|
The cluster start time for the cumulative period. |
|
The timestamp of the record. |
The following is an example record of the collected data from a cluster:
{
  "nodeEnvironment": "testing",
  "instanceId": "9236536d-16fa-473e-9aa2-dd1549de587c",
  "startTime": 1677112905047,
  "nodeVersion": "407-e.0",
  "time": "2023-02-23T01:00:38.648Z",
  "cumulativeCpuTime": "4754.86s",
  "cumulativeAvailableCpuTime": "27184.81s",
  "cores": 24,
  "activeNodes": 3,
  "signature": "a634d22f4804c6b369f722f786b724105eddba2f6796768d3d688e9d96ad9fdc",
  "licenseOwner": "testing",
  "licenseType": "JSON",
  "licenseHash": "f2ca1bb6c7e907d06dafe4687e579fce76b37e4e93b7605022da52e6ccc26fd2"
}
The collected data is sent to Starburst endpoints.
Proxy configuration#
If your network configuration blocks SEP’s automatic usage metrics upload, you
can configure the insights.data-upload.endpoint configuration property to
specify a proxy server that is allowed to access those external endpoints:
insights.data-upload.http-client.http-proxy=proxy-to-use.internal.network:8000
If the proxy server is secured and you need to trust its certificate, add the truststore used by the client with the following configuration:
insights.data-upload.http-client.http-proxy.secure=true
insights.data-upload.http-client.trust-store-path=path/to/truststore.jks
insights.data-upload.http-client.trust-store-password=truststore-password
Manual upload#
If the network upstream of your SEP cluster blocks the automatic usage
metric upload and you are unable to configure a proxy, or disable the automatic
upload by setting insights.data-upload-automatic.enabled to false. You can
then manually upload usage metrics data by following these steps:
Download the usage metrics file from the Usage metrics in the Insights section of the Starburst Enterprise web UI.
On a device with internet access, upload the metrics file to Starburst.