Insights cluster history#
The cluster history tab is accessed in Insights by clicking on Admin > Cluster history in the left-hand navigation.
It provides access to metrics indicative of the load of the Starburst Enterprise platform (SEP) cluster for a given time range. The start date and time of the interval for which the metrics are displayed must be specified. The end date and time defaults to the current date/time:
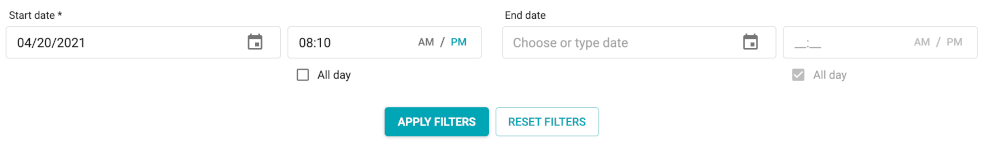
For open-ended time ranges, click Refresh Results in the upper right.
Cluster history charts#
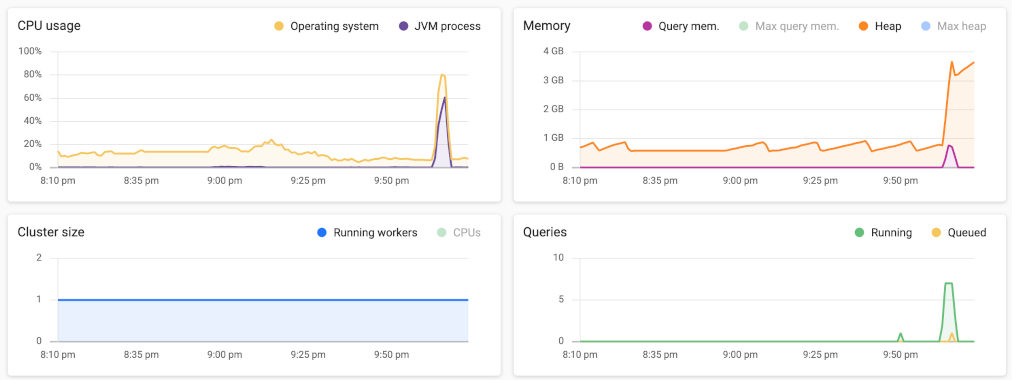
CPU usage#
The CPU usage chart shows the average CPU used by the operating system and the Java processes running SEP, aggregated for all cluster nodes for the selected time range.
Memory#
The Memory chart shows memory usage aggregated for all cluster nodes. Various metrics can be shown on the chart:
Query memory - The average memory used by all queries over a given time period
Maximum query memory - The maximum memory available to queries cluster wide
Heap memory - The amount of heap memory used by the JVMs across all cluster nodes
Maximum heap - The maximum amount of heap memory configured in the JVM aggregated across the entire cluster
You can read about memory configuration in the memory management and JVM configuration documentation.
Cluster size#
The Cluster size chart shows the number of nodes and CPUs for the selected interval.
Queries#
The Queries chart shows the average number of running and queued queries at various points in time.