Insights query details#
Click on a specific query ID in the Insights query overview pane to view Query details for that query.
The Query details pane displays general and advanced information about a specific query. Use the Back button to navigate back to the query history.
General#
The General tab provides high-level information about the query processing.
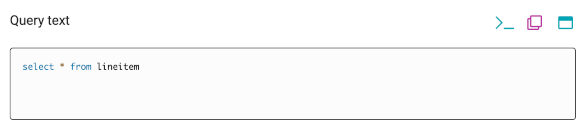
Query text#
The Query text shows the SQL statement as submitted to the SEP cluster for processing. You can copy the text with the copy icon, or maximize the text area with the window icon. You can re-run the query in the Starburst Enterprise query editor overview by clicking the >_ icon.
Basic information#
The displayed metadata about the query processing includes the following information:
ID: The query identifier.
User: The user who submitted the query.
Principal: The security principal derived from the user.
User groups: The groups associated with the user.
Client: The identifier supplied by the client application, that submitted the query.
Client address: The IP address of the client application.
CPU time: The total cumulative CPU time used by this query,
Elapsed time: The elapsed time for processing the query in milliseconds.
Resource Group ID - The resource group that the query belongs to.
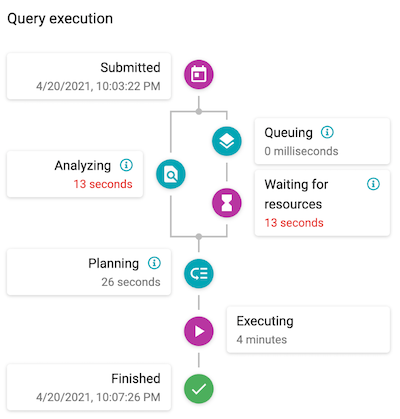
Query execution#
The Query execution diagram displays performance and timing data about query processing:
Cluster resources#
The Cluster resources tab provides information about the cluster load during the time when the query was queued and executing. Query execution times are influenced by the available resources (CPU, memory), and the number of concurrent queries. This tab provides you with the context necessary to interpret query execution data.
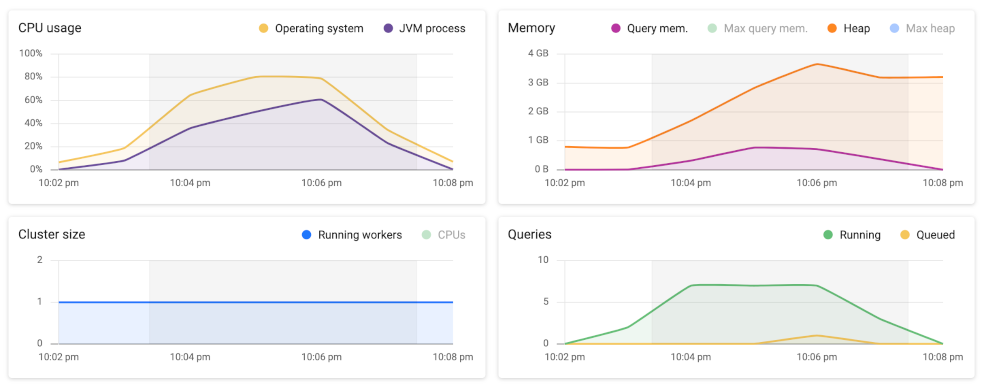
The charts included in this tab are similar to the ones on the cluster history pane. They additionally show the time range when the query ran as a highlighted area on the timeline.
Stages#
The Stages tab shows details about query processing stages. A stage is the
runtime incarnation of a plan fragment in a distributed query plan, and is
identified by a stage number. The maximum number of stages in a query plan is
defined by the query.max-stage-count configuration property.
Caution
This tab is for advanced users with a very good understanding of query processing. The following materials can help you begin to understand the necessary concepts:
Starburst video training to learn how SEP executes queries
The following information is included on this tab that applies to the query and its processing as a whole:
User: The user who submitted the query.
Query state: The current status of the query in the processing flow. Possible values include queued, planning, starting, running, blocked, finishing, finished, and failed.
CPU time: Total cumulative CPU time used by this query,
Elapsed time: The elapsed time for the query.
Active: The percentage ratio of processing time compared to wait times.
Query status#
Query statuses are dependent on the statuses of its stages and tasks. Generally,
queries start in the QUEUED state, and move on briefly to the PLANNING
state. Queries may return to QUEUED state if they must briefly wait for
resources. If the resources are not available fast enough, the time period
depending on a myriad of configuration properties, it moves into a BLOCKED
state. If at least one worker task is running and nothing is blocked, the query
is in the RUNNING state.
Note
The PLANNING stage should be very brief for most queries. If you notice
that queries are spending more than a brief amount of time in the PLANNING
stage consistently, your cluster may have insufficient resources.
Stages encompass all the tasks of the work described by the stage’s plan fragment. Stages can be in one of several states:
Planned: The coordinator created the query plan, and from that, the distributed query plan.
Scheduling: The coordinator is scheduling tasks across workers.
Scheduling splits: The coordinator is scheduling tasks on workers using the list of splits.
Scheduled: All workers have tasks, and the coordinator is waiting for the first task to start running.
Running: There is at least one running task.
Flushing: Stage has finished executing and output being consumed. At least one of the tasks is flushing and the non-flushing tasks are finished.
Finished: The query has finished executing and all output has been consumed.
Canceled: The query was canceled by the user.
Aborted: Stage was aborted by the coordinator.
Failed: Query execution failed.
Stage views#
Query stage information is rendered in two different views, List and Graph. Use the toggle in the upper right corner to switch between the two visualizations.
List view#
List view shows a list of stages and includes information about the associated tasks:
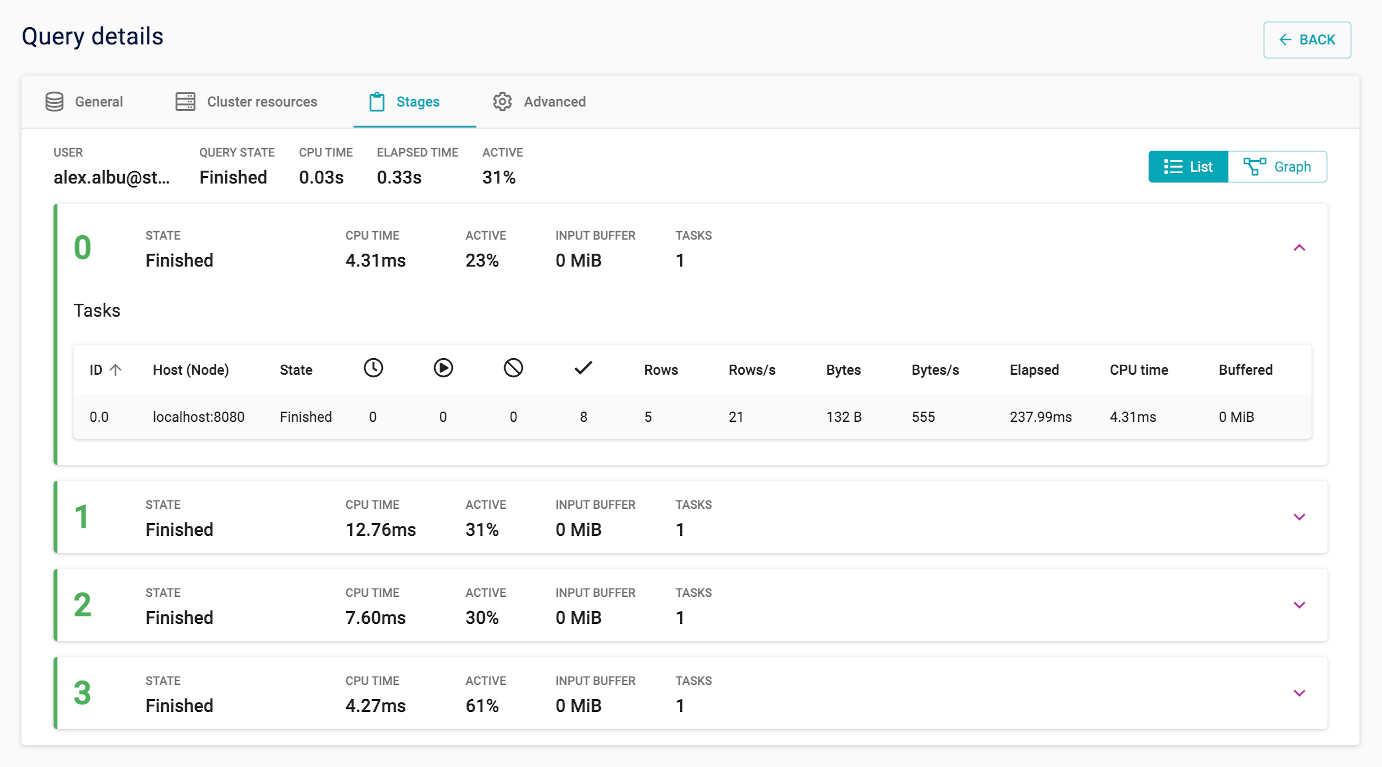
The list view focuses on statistics about stages and their tasks. This view is useful for examining stage performance, and understanding if all nodes in the cluster perform well.
Several stage level statistics are shown:
State: State of the task.
CPU time: Total cumulative CPU time used by this query.
Active percentage: The percentage of
CPU timeout of the total scheduled time, which includes bothCPU timeand waiting times. This metric estimates the query’s processing efficiency. Ideally, the value should be a high percentage. A low percentage indicates the query is spending a long time reading from storage.Input buffer: Data received during the exchange that is kept in buffers on the target and source sides of the exchange. The buffer sizes for each side can be adjusted independently.
Number of tasks: The total number of tasks.
Each stage can be expanded or collapsed with the chevron in its upper right corner. Expanding a stage reveals task level details. Stages can have multiple tasks, which have their own row with separate statistics and statuses in the stage panel. Tasks are assigned to workers to be executed in parallel. Comparing task statistics within the same stage can identify bottlenecks caused by slower nodes.
Tasks can be in one of the following states:
Planned: The plan has been created by the coordinator.
Running: The task is running.
Flushing: The task is flushing results after having been consumed.
Finished: The task is complete and its data passed on to the next split.
Canceled: The task was canceled by the coordinator due to a user action.
Aborted: The task was aborted by the worker or coordinator.
Failed: The task failed to execute.
The following per-task statistics are displayed:
Host: URI of the node processing the task.
State: State of the task.
Queued splits: Number of splits in the task not yet running.
Running splits: Number of splits in the task not yet complete.
Blocked splits: Number of blocked splits in the task.
Completed splits: Number of completed splits in the task.
Rows: Number of rows processed by the task.
Rows per second: Rate at which rows are processed by the task.
Bytes: Number of bytes processed by the task.
Bytes per second: Rate at which bytes are processed by the task.
Elapsed: Elapsed time since the task creation.
CPU time: Total cumulative CPU time used by the task.
Buffered: Amount of data waiting to be sent to the next processing stage (high values may indicate that the upstream stage is slow).
Graph view#
Graph (tree) view depicts stages and the way data flows between them in parent-child relationships:
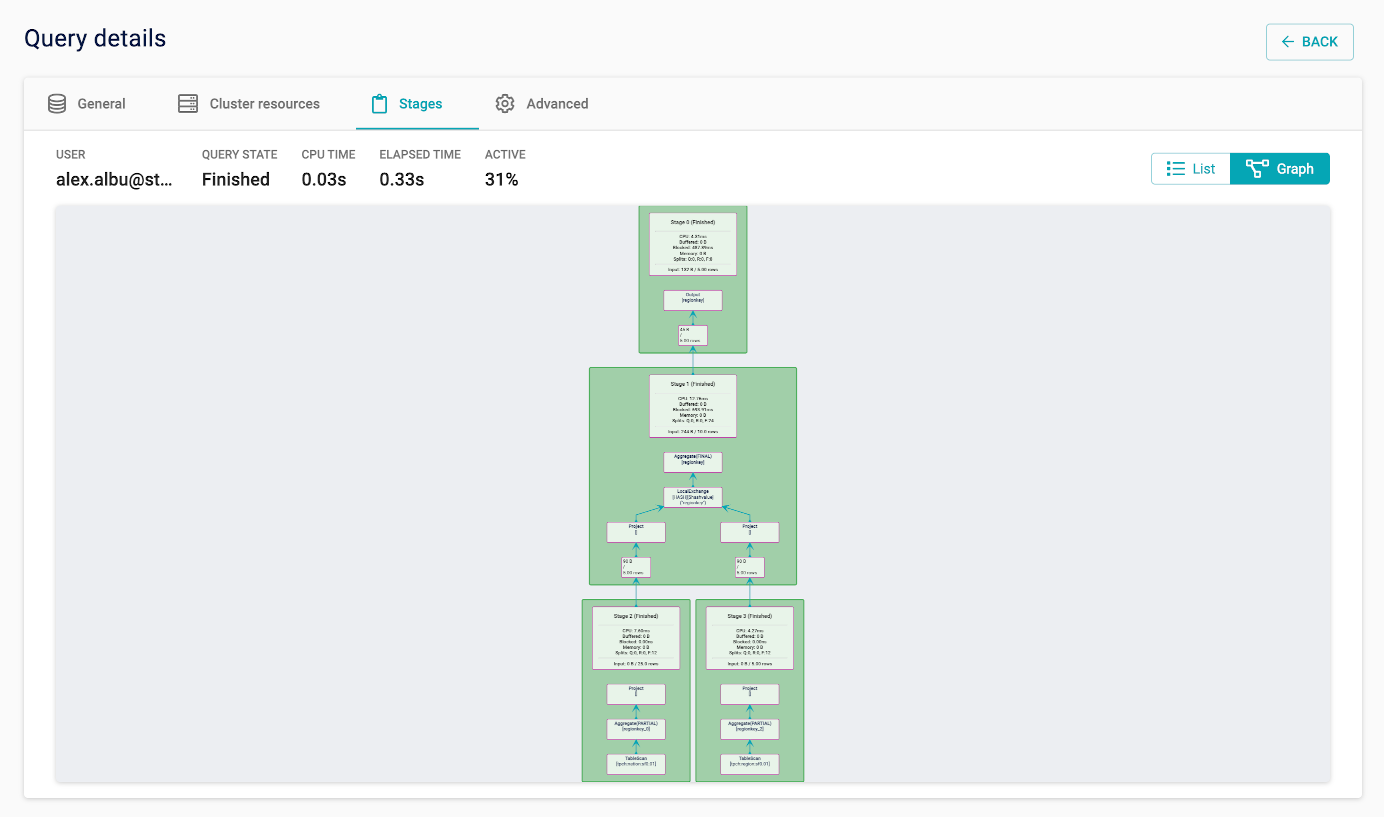
Graph view is available only for queries for which the coordinator still has
information in memory. How long query information is retained in memory depends
on the query volume, as well as the query.max-history and
query.min-expire-age configuration properties. The view provides a
visualization of the distributed query plan and shows how plan fragments are
mapped to stages. The visual representation is a tree, in which nodes represent
stages and edges indicate how data is transferred between stages. A stage
processes data produced by its children.
Each of the nodes shows stage level statistics, as well as a graphical representation of the corresponding plan fragment. A plan fragment is rendered as a tree of operators. Finally, statistics about the number of rows and total size of the data read from each child stage are also shown.
Advanced#
The Advanced tab provides lower level details about the query processing.
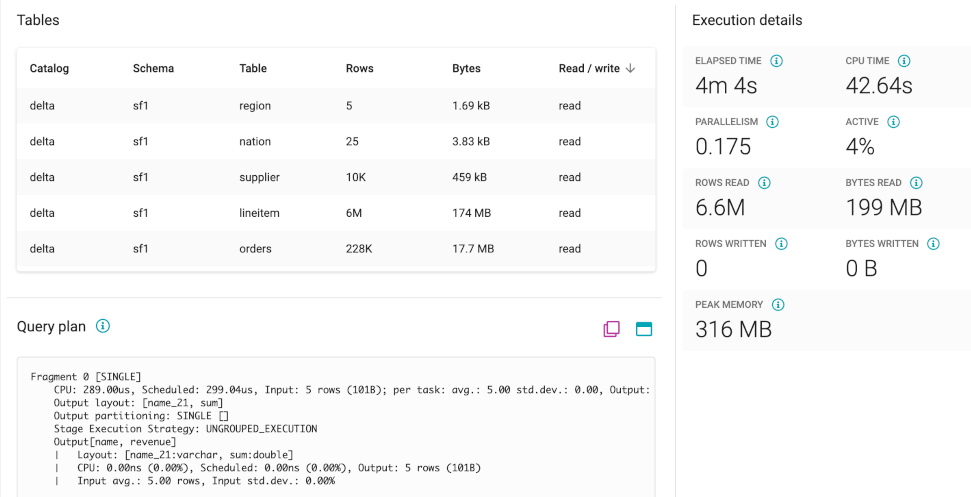
Tables#
A list of all tables accessed by the query, including the following information:
Table: Name of the table accessed by the SQL query.
Schema: Name of the schema that contains the table in this row.
Catalog: Name of the catalog that contains the table in this row.
Rows processed: Number of rows processed from the table.
Bytes processed: Number of bytes processed from the table.
Read or write operation: The operation type for the data.
Query plan#
The query plan used for processing the query on the cluster. It can be copied or maximized using the icons.
Execution details#
You can see the following timing and performance details about query processing on the cluster:
Elapsed time: The amount of time in milliseconds it took the query to execute.
CPU time: Total accumulated CPU time in milliseconds across workers and threads.
Parallelism: Estimated value of how much the workload was processed in parallel, calculated from
CPU timedivided by theElapsed time.Active: Estimated value of how efficient processing was performed, calculated from
CPU timedivided by thetime spent waiting as scheduled.Rows read: Total number of rows read from the data sources.
Bytes read: Total number of bytes read from the data sources.
Rows written: Total number of written rows.
Bytes written: Total Number of written bytes.
Peak memory: Maximum amount of memory directly tied to query resources used by a query at one time.
Index and cache usage#
The Index and cache usage tab provides summary statistics that indicate the performance gains from using Starburst Warp Speed.
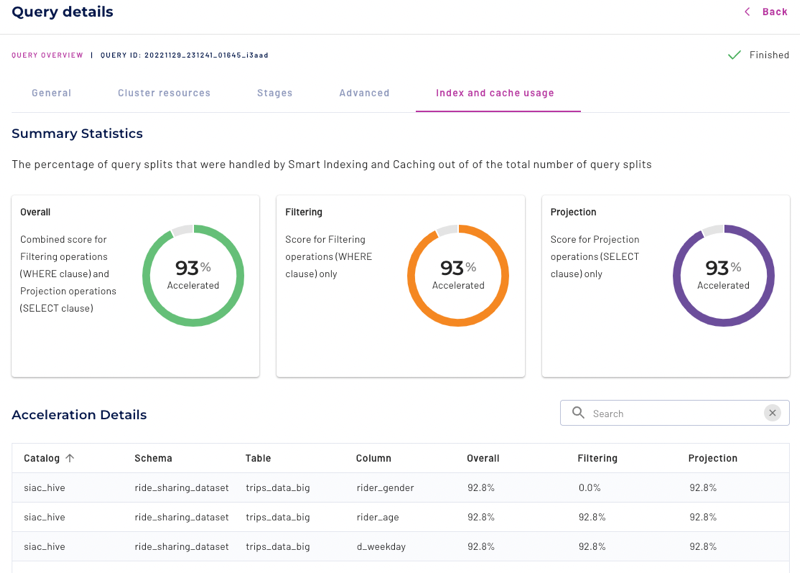
Acceleration details#
You can see the following acceleration details about index and cache usage for each column accessed by a query:
Catalog: Name of the catalog configured for Starburst Warp Speed that contains the table in this row.
Schema: Name of the schema that contains the table in this row.
Table: Name of the table accessed by the SQL query.
Column: Name of the column accessed by the SQL query.
Overall: Combined score for performance gains from filtering and projection.
Filtering: Indicates acceleration based on indexing. Percentage score for independent predicates in the
WHEREclause.Projection: Indicates acceleration based on the data cache. Percentage score for items in
SELECTclauses.