Insights query overview#
The query overview tab is accessed in Insights by clicking on Query > Query Overview in the left-hand navigation.
Insights query overview provides information about running, queued, completed, and failed queries processed on the SEP cluster.
Filters#
Insights provides filters that allow you to choose what data is displayed:
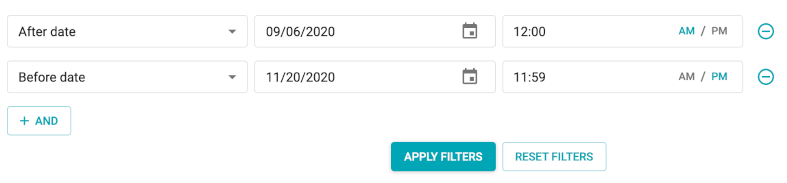
These filters are defined at the top of the page. Query attributes can be
combined in a single filter with a logical AND. The following attributes are
available for use as filters:
After date
Before date
Query text
User
User group
Query ID
Status
Catalog
Schema
Queries table#
The table of queries, located beneath the filters, includes the following columns:
Status
Query ID
Query text
User
Create date
CPU time
Elapsed time
Resource group ID
Clicking Query ID allows you to access further query details.
Clicking Edit in query editor for the query text takes you to the Starburst Enterprise query editor overview, where you can edit the query as needed, and run it.
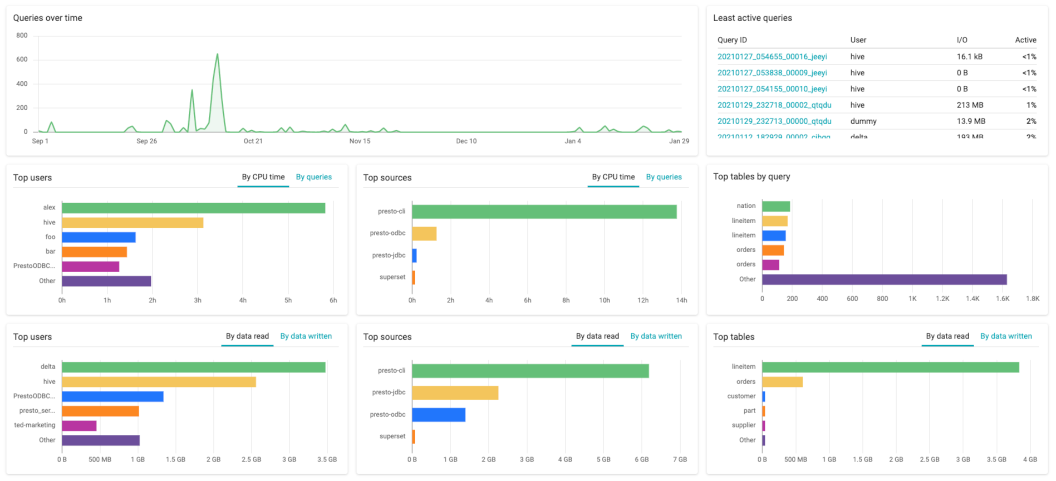
Completed queries report#
A report detailing completed queries is accessed using the Reports button on the right.
Note
Reports do not include data about running and queued queries.
The Reports pane includes the following charts:
Queries over time
Top 5 users by CPU time or queries
Top 5 users by data read or written
Top 5 sources by CPU time or queries
Top 5 sources by data read or written
Top 5 tables by data read or written
Top 5 clients by number of queries