Configuring Starburst Enterprise with CloudWatch in CFT#
Note
As of 474-e, the AWS CloudFormation Template (CFT) deployment method is deprecated and will be removed in a future release. Support will continue through May 2026. Starburst recommends that you migrate to an alternative deployment method, such as Amazon EKS, prior to May 2026. Contact your Starburst account team with questions or feedback.
The Starburst Enterprise platform (SEP) CloudFormation template provides integration with CloudWatch for logging and metric collection. The following sections detail how to collect logs in CloudWatch and set up the metrics integration.
CloudWatch logs#
Starburst’s CloudFormation template automatically integrates with CloudWatch
Logs. Logs from SEP nodes are uploaded to log streams in a
/starburstdata/enterprise/STACK_NAME log group. Additionally, log files are
stored and rotated on nodes themselves.
Log stream names use the STREAM-ROLE-INSTANCEID format where:
ROLEis eithercoordinatororworkerINSTANCEIDis an instance ID designated by AWS
STREAM can be one of the following:
starburst: Contains the SEP server logsautoconfiguration: Contains auto-configuration script logssecurity: Contains query and user information for queries issued to the coordinator (see Query audit)graceful-scaledown: Contains graceful scale down handling script logs (there is a separate stream for each worker instance)ha-heartbeat: Contains HA heartbeat script logs (there is a separate stream for each worker instance)
CloudWatch metrics#
Metrics integration can be enabled with the
EnableCloudWatchMetrics template property. When enabled, detailed OS and
SEP metrics are collected and uploaded to CloudWatch metrics service.
Additionally, a CloudWatch Dashboard with cluster overview is created.
Metrics are stored within the Starburst CloudWatch metrics namespace with a
collection interval of 10 seconds. Metrics are split into Node and
Starburst types.
Pricing#
Note that AWS CloudWatch metrics, dashboard, and API requests cost a fee based on usage. While the number of aggregated metrics is constant (below 30), the number of per-node metrics scales with the number of nodes. There are a total of 21 metrics per node.
Node metrics#
All node metrics contain the following dimensions:
Category: Eithercpu,memory,net, ordiskioInstanceId: An instance ID designated by AWSStarburstNodeRole: EithercoordinatororworkerStarburstStackName: The name of a CloudFormation stackType: This dimension is alwaysNodehost: The private, internal hostname of the instance
The following node metrics are collected:
cpu_usage_idle,cpu_usage_iowait,cpu_usage_system,cpu_usage_softirq,cpu_usage_idle: Percentage of a node’s CPU usage. These metrics additionally contain thecpudimension which is alwayscpu-total.mem_used,mem_cached,mem_free: Node OS memory usage.net_bytes_recv,net_bytes_sent: Amount of bytes sent and read within the last collection interval. These metrics additionally contain theinterfacedimension which is alwayseth0.diskio_read_bytes,diskio_write_bytes: Amount of bytes read and written within the last collection interval. These metrics additionally contain thenamedimension which is alwaysxvda1.
SEP metrics#
All SEP metrics contain the following dimensions:
Category: EitherexecutorormemoryInstanceId: An instance ID designated by AWSStarburstNodeRole: EithercoordinatororworkerStarburstStackName: The name of a CloudFormation stackType: This dimension is alwaysStarbursthost: The private, internal hostname of the instancemetric_type: Eithercounterortiming
The following SEP metrics are collected:
RunningQueries: The number of currently running queries.QueuedQueries: The number of currently queued queries.HeapMemoryUsage_used,HeapMemoryUsage_committed,HeapMemoryUsage_max: JVM heap memory usage metrics. For more information, see the MemoryMXBean documentation.NonHeapMemoryUsage_used,HeapMemoryUsage_committed: JVM non-heap memory usage metrics. For more information, see the MemoryMXBean documentation.gc_young_CollectionCount,gc_young_CollectionTime: Counter and timer for G1 young and mixed collections. For more information, see the GarbageCollectorMXBean documentation.gc_old_CollectionCount,gc_old_CollectionTime: Counter and timer for G1 full collections. Ideally, those metrics should always be 0. For more information, see the GarbageCollectorMXBean documentation.
Aggregated metrics#
Alongside per-node metrics, there are also aggregated metrics with data from
all workers. These aggregated metrics only contain the Category,
StarburstNodeRole, StarburstStackName, and Type dimensions.
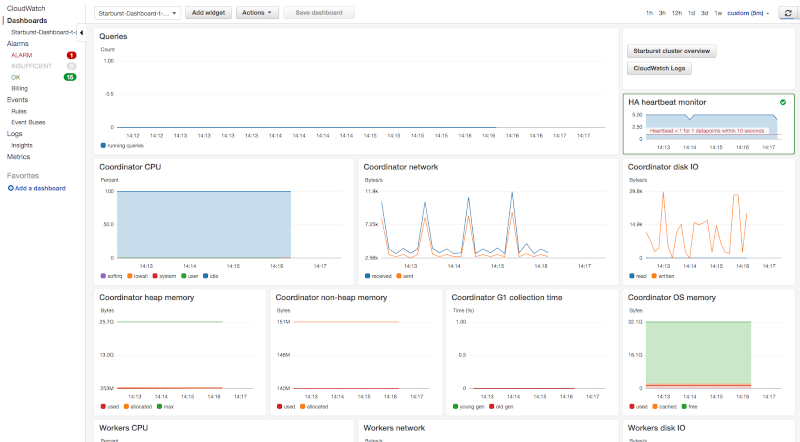
Dashboard#
When metrics are enabled, the SEP CFT creates a cluster
overview dashboard with a Starburst-Dashboard-STACK_NAME format name. This
dashboard contains charts that provide visualization of collected metrics for
the coordinator and workers, but also the
HA alarm state and useful
SEP links.
Troubleshooting#
Metrics and the cluster dashboard can be used to troubleshoot
performance issues. For example, SEP should never trigger full G1 garbage
collection during normal operation so the gc_old_CollectionCount
and gc_old_CollectionTime metrics should always be 0.
Metrics can also be used to investigate cluster bottlenecks. For example, metrics will indicate if the cluster fully utilizes network, cpu, or disk capacity.